
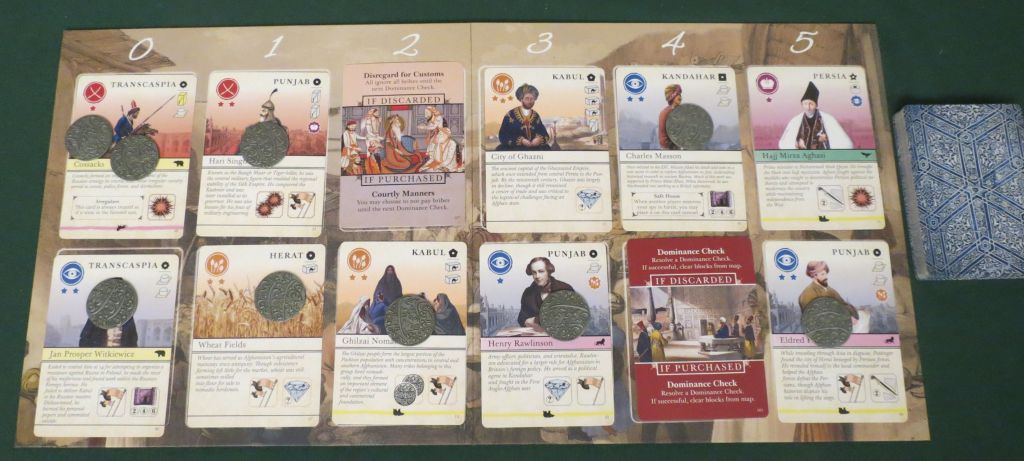
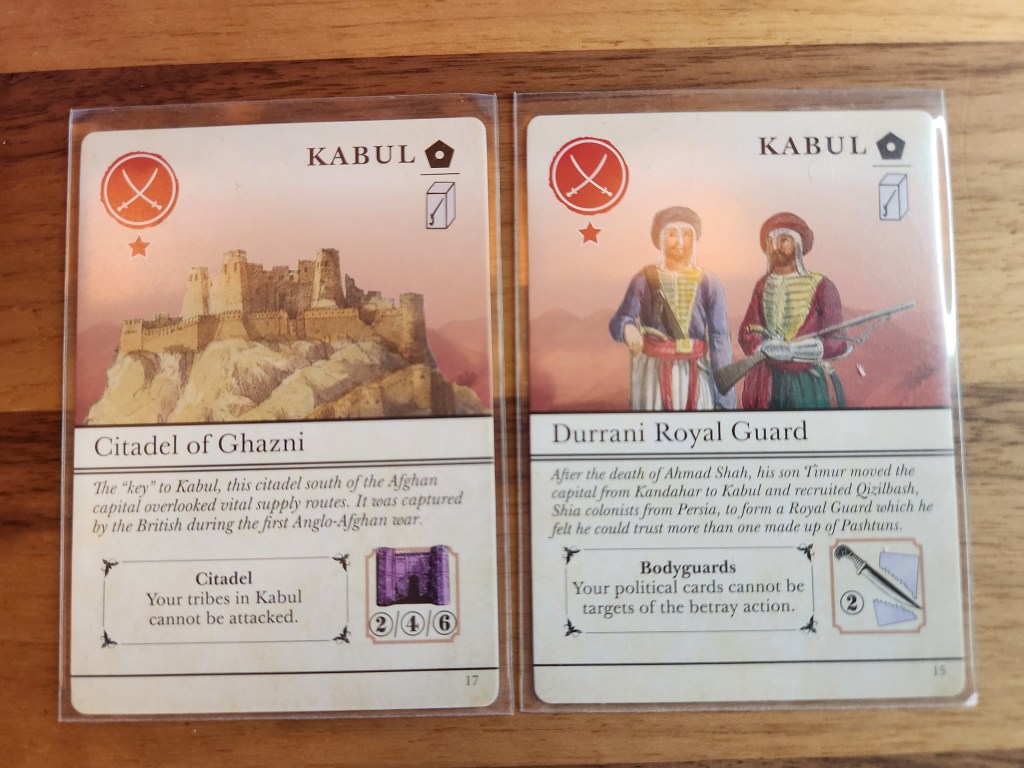
I recently cited the second edition of Pax Pamir, Second Edition as an exemplar in parsimonious use of text. Of the 100 court cards in the game, remarkably little text is needed, and what text exists is overwhelmingly flavor text. The court cards are so efficient in their representation of complex mechanics that the vast majority of space on each card is consumed by an image, historical context, and a name.
But how much information is represented on each card? And how efficiently is that information presented? For answers, we turn to information science.
The math
Information entropy is a measure of how generally surprising a distribution is. It is related to probability, so let’s start there. An event x that’s certain to happen has probability 1, or P(x) = 1. An event x that’s impossible has probability zero, or P(x) = 0. Probability is the likelihood that something happens and unlikelihood is 1 – P(x).
1 – P(x), unlikelihood, is the additive complement to probability, but what about the multiplicative complement, 1/P(x)? That’s getting close to entropy, but for now let’s call it surprisal, that is, how surprising is the event x.
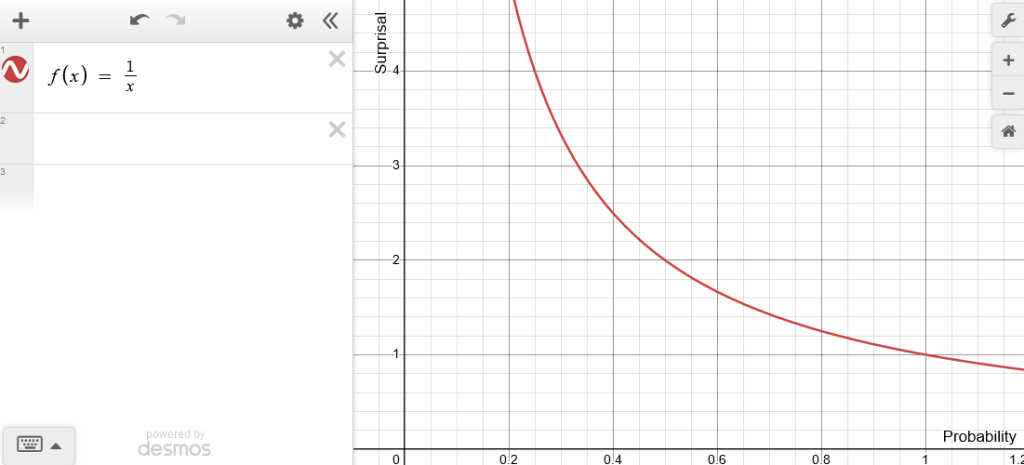
This is trending in the right direction, since as probability approaches zero, surprisal approaches infinity; if something impossible happens, we should be infinitely surprised. When probably equals 1, however, the surprisal is also 1, which feels weird; we should be zero surprised when something absolutely certain happens. We could correct this in a couple ways, such as simply subtracting 1 from the whole graph, but for reasons we’ll see later, we’ll take the base 2 logarithm of it instead.

Now it behaves how we imagine surprise behaves, with infinite surprise when something impossible happens and zero surprise when something certain happens. As it happens, log2(1/P(x)) = -log2(P(x)), so let’s just write it that way.
In information theory, the entropy of a random variable is the average level of “information”, “surprise”, or “uncertainty” inherent to the variable’s possible outcomes.
This surprisal function is related to probability, but is actually its own measure. This means that for a given distribution, we can compute an expectation, or a mean, of it: the sum of the surprisal of each element weighted by that elements probability, a quantity usually denoted with the letter H.

This is the entropy of a set or distribution, the average amount of surprise. How surprising something is also tells you how much information it stores; telling your friend you didn’t get hit by an airplane today doesn’t carry much novel information and is not surprising. Telling them you did get hit by a plane is the opposite.
The application
We can use this math to define how much information is contained in a given icon on a card by looking at the distribution of that symbol. For example, each card has a suit, shown in the upper left corner, which is one of Political, Economic, Intelligence, or Military.
They’re pretty evenly divided:

We can apply the entropy equation above to find the average amount of information the suit symbol carries:

As it happens, an evenly divided set is the most surprising set possible, which means each possible suit carries about the same amount of information: 2 bits. This makes intuitive sense; there are 4 possible suits and 2 bits can represent 4 values. (I am mixing bits of memory and bits of entropy here. They’re different, but the comparison is sensible). The suit would hold exactly 2 bits of information if the suits were perfectly evenly divided; for 100 court cards with 25 cards of each suit, the suit would carry on average 2 bits of information. In this case, the slight difference in distribution changes the entropy of the suit symbol.
We can see how much information each individual suit carries.

The weighted_bits field is adjusted by probability, so that column will add up to the total entropy of the set of suits computed above. The bits column tells us how much information each individual suit symbol carries. It boils down to the principle that less likely events carry more information than very likely events. There are more Economics suited cards than Political suited cards, so the Economics suit symbol carries less information: 1.83 bits vs 2.12 bits.
Each card also has a rank, a representation of how powerful the card is, ranging from 1 to 3 stars; it’s located under the suit symbol. We can see a more extreme distribution by looking at the rank.

Out of 100 court cards, only 5 are rank 3. How does the entropy and information distribution shake out there?

Rank 1 cards are the most common, so they carry relatively less information. When the cards rank symbol is 3, however, this carries a lot of information, 4.32 bits vs 0.83 bits, simply because of how unlikely it generally is; if you topdeck a random card and it’s rank 3, you should be very surprised, over 3x as surprised as if it was a rank 2 card.
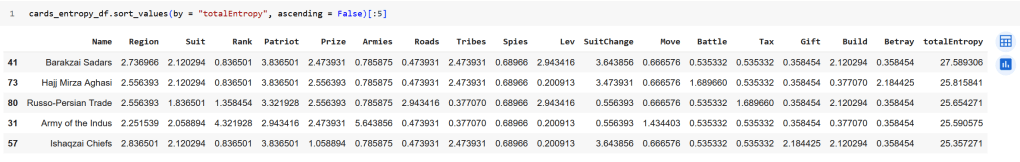
We can do this for every value of every icon on the cards and arrive at the information content of each.
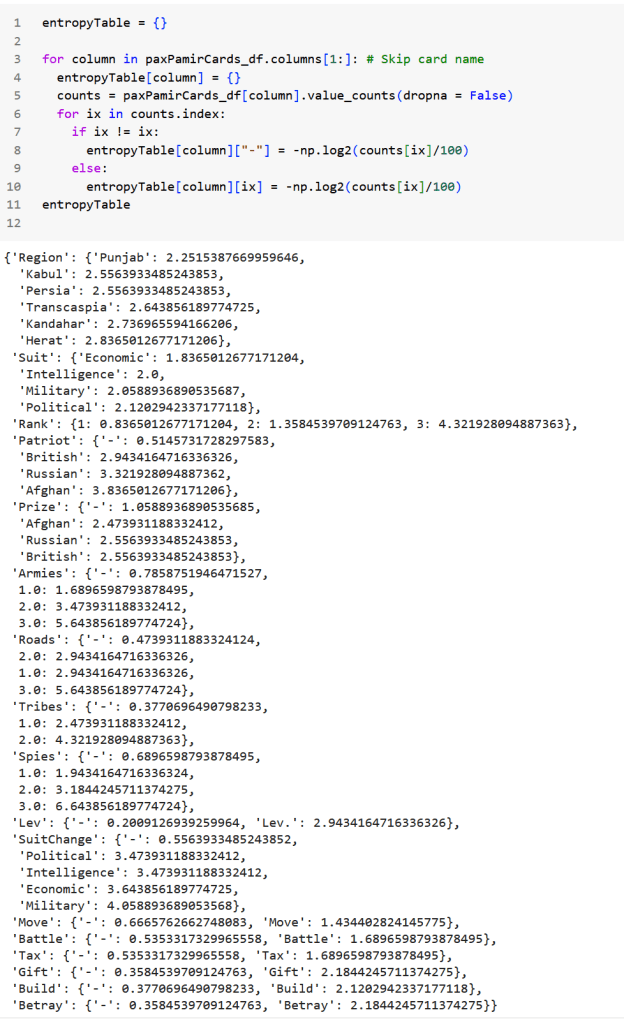
This is getting a bit ahead of ourselves, but note that the absence of something is not different from the presence of something from an information content standpoint; if the word Trample is not on a magic card, it doesn’t tell you nothing, it tells you that it doesn’t have Trample. Similarly, look at the Betray action at the bottom. Most cards don’t provide the Betray action, so its absence provides only a little, but not zero, information.
This also allows us to comparative availability of different effects. If you had to choose between a card that placed 2 tribes or 3 armies, which would you choose? We see that placing 2 tribes is 4.32 bits of surprise while placing 3 armies is 5.64 bits of surprise; if you judge both as equally valuable in the given game state, you should pick the card that places 3 armies, since it’s more than 1 bit more surprising to see, i.e, it’s less than half as likely.
Here’s why the logarithm is the correct choice above for calibrating surprisal: even though the probabilities all of these aspects of the cards combine multiplicatively, their information combines additively. That means we can simply add up the information content of each of the icons on the card to arrive at the non-text information content of each card.

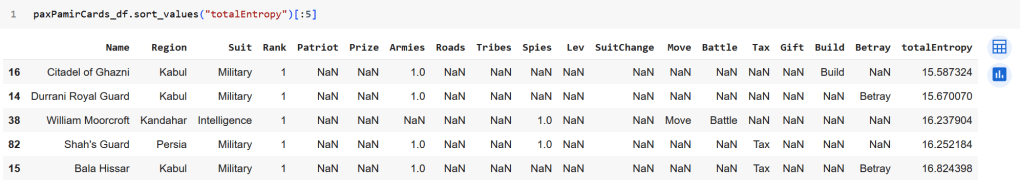
Then we can look at the most and then least information-dense cards.
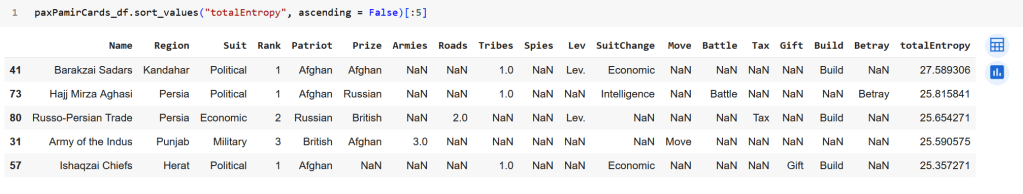


We can immediately see that the math lines up with our intuition. The most information-dense cards clearly have more going on than the least, but what’s critical here is a) we can measure by how much one card is more informative than another, b) we can figure out where on the card that information is coming from, and c) it doesn’t matter what the information means.
For the most information-dense cards, the fact that they’re all both patriots and prizes jumps their information content way up, as does the presence of a suit change. The leverage icon is also unusual, so it carries a large amount of information.
Conversely, it’s easy to intuit that the lowest information cards are correctly assessed: not patriots, not prizes, no suit change, few pieces added, no leverage, low rank, etc.
We see that our intuition lines up with the math; we can be confident that the math represents what we think it does.
Let’s look at the information density.

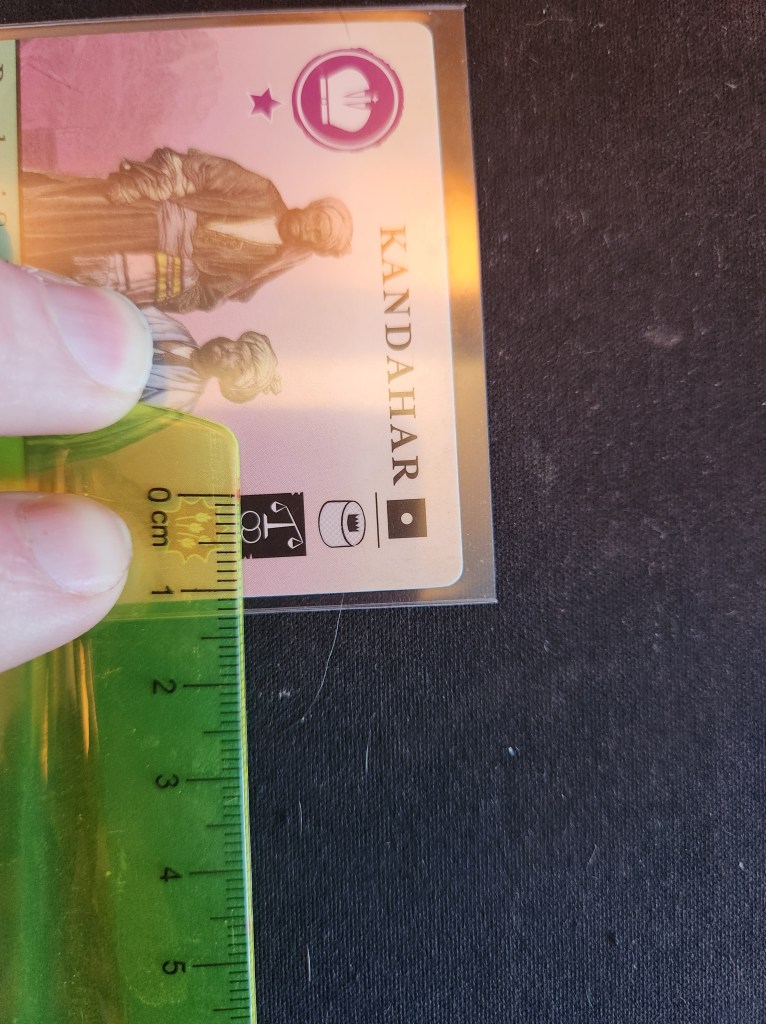
29mm x 7mm = 203mm2 = 2.03cm2
In this area, the card display the location (the square shape), the addition of a single tribe, leverage, and the Economic suit change. That’s ~2.73 bits + ~2.47 bits + ~2.94 bits + ~3.64 bits = 11.80 bits of information.
That means this area has an information density of 11.80/2.03 bits/cm2 = 5.81 bits/cm2 .
One can trivially maximize information density by making icons infinitesimally small icons. Obviously awful.
NOTE THOUGH that it’s actually showing more information than that! The card doesn’t add any armies, roads, or spies. It displays this information by not showing icons for them. This means that without taking additional area, the card expresses additional information, specifically 1.95 additional bits of information without taking additional area or cognitive load.
That brings the information density of this portion of the card to 6.7 bits/cm2 .
Looking at the entropy for each piece of information that can be demonstrated on each card:

The science for game designers
There are lots of avenues I want to take this kind of analysis (what’s the mutual information between visual data encodings? i.e, does the word “trample” on a green Magic card encode as much information as “trample” on a blue card?) and I’d like to arrive at some axioms for game design that rely on maximizing or minimizing some derivation of information entropy. We see a bit of that here; if some element of a set encodes the least information of all set elements by a lot, it’s better to indicate it by an absence of an icon instead of an actual icon.
As in many optimization cases, a first draft of an objective function does not produce an optimal product; one can trivially maximize information density by making icons infinitesimally small icons. Obviously awful. Data density, on its own, is an imperfect instrument.
I’d also like to compute what Tufte would call “data ink”, what percentage of the available space is dedicated to how much information?
Data visualization is a critical part of board game design. A board game has a finite board, same with cards, so reckless use of space is particularly egregious, and unlike video games, you can’t patch the interface later. Making smart choices about card iconography and text is a first-class concern of physical game design, as important as mechanics, theme, and production.
So in this blog, I’ll look at different games from an information science perspective and see what we find.
